Knowledge Base
Acquiring Messenger subscribers is the first & foremost thing that you need to do for promoting your business.
Few parts of analytics in the dashboard section are dedicated to provide the new user analytic details. So that you can improve the subscriber acquisition more efficiently.
In your dashboard section, you will get loads of information for the new user data that are highlighted in the above image.
New Users (a) – In this column, you will find the number of new users in the numerical format and numbers below will show the increase/decrease of new users in percentage respective to the selected timeline.
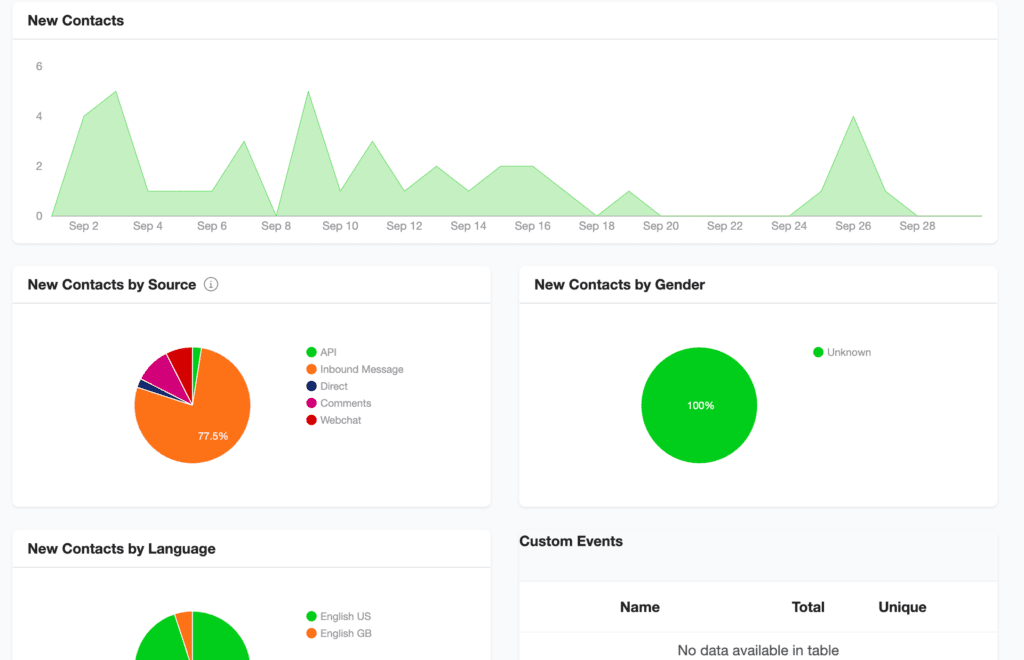
New Users (b) – This column will show you the number of new users in graphical format with respect to the date (in X-axis) and user count (in Y-axis).
New User by Source – Pie chart in this column will show the source where Messenger subscribers had come from. It will help you to know where your potential audience is so that you can optimize to obtain more Messenger subscribers.
New User by Gender – It is also a pie chart which gives the detail of subscribers’ gender that are obtained from Facebook. USe this detail for targeting your products and services.
New User by language – Know what your subscribers’ are speaking and get in-depth details about the new users’ language (fetched from Facebook) in the form of pie chart
Hope this article helps you to know more about “New user Data” in our dashboard section on Botosynthesis platform.
If you have any other doubts or queries, visit other articles on the knowledge base or interact with our community or contact our support to get your doubts cleared.